 Skip to content

In a recent video interview with Processing Magazine, Sage Metering President Fred Whorff discusses the rapidly changing energy landscape affecting industrial energy consumers, and the importance of understanding exactly how much gas is being consumed in real time, across all operating modes.
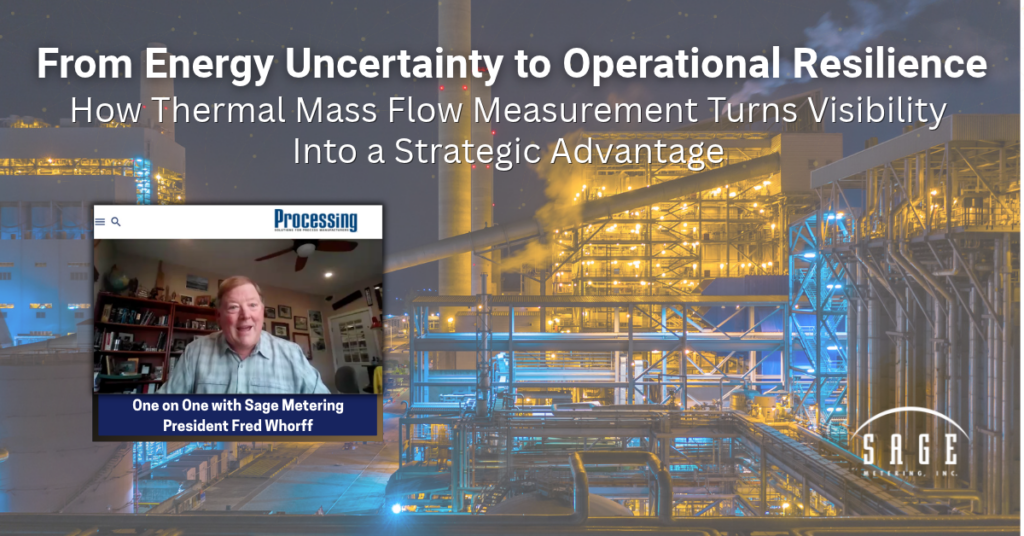
Taking Control of Industrial Energy Starts with Flow Visibility
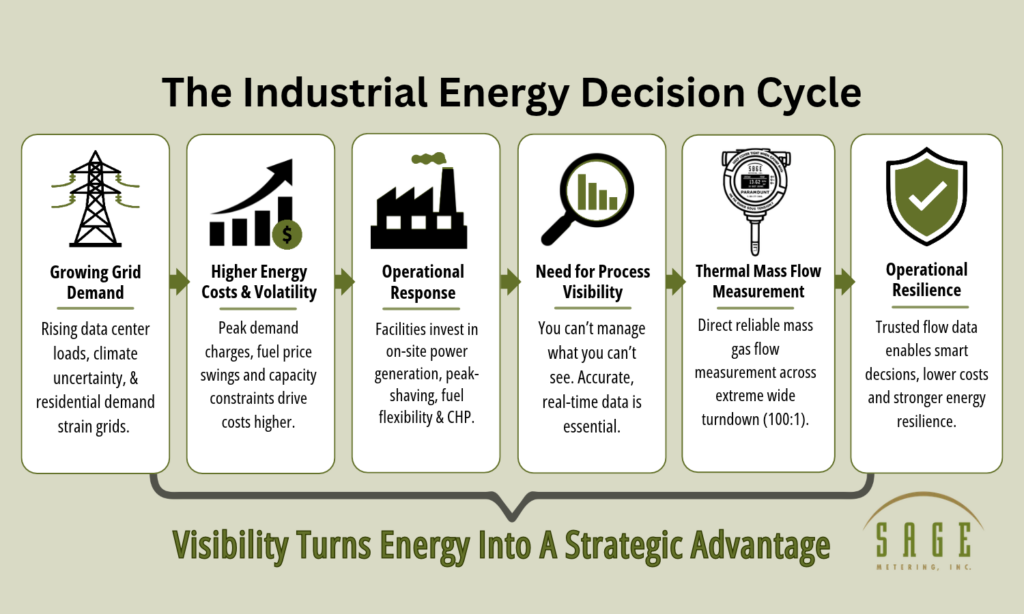
Rising energy costs, data center growth, and concerns about grid reliability are just a few of the issues prompting industrial facilities to reconsider their dependence on outside power.
To adapt to the shifts in today’s uncertain energy landscape, many industrial operators are increasing their investment in on-site generation, peak shaving, and combined heat and power (CHP) to gain greater control over energy availability and soaring operating costs.
For even greater control over their energy supply, operators must also understand how much fuel their equipment consumes, how that consumption changes with demand, and how effectively it supports production. Greater control depends on greater visibility.
In a recent interview with Processing Magazine, Sage Metering President Fred Whorff explores how thermal mass flow measurement helps operators close those information gaps and make more informed decisions as their energy systems become more complex.
Watch Fred’s complete interview with Processing Magazine.

On-Site Generation Expands the Measurement Challenge
The decision to generate power on-site naturally draws attention to generators, switchgear, and electrical output, but that is just part of the picture; facilities must also consider fuel input and the timing of consumption. Thermal mass flow measurement helps operators track gas consumption as operating conditions and energy demand change.
As Fred explains to Processing Magazine’s Editor-In-Chief, Jesse Osborne, operators need to understand how gas use relates to the power they produce and the load they serve.
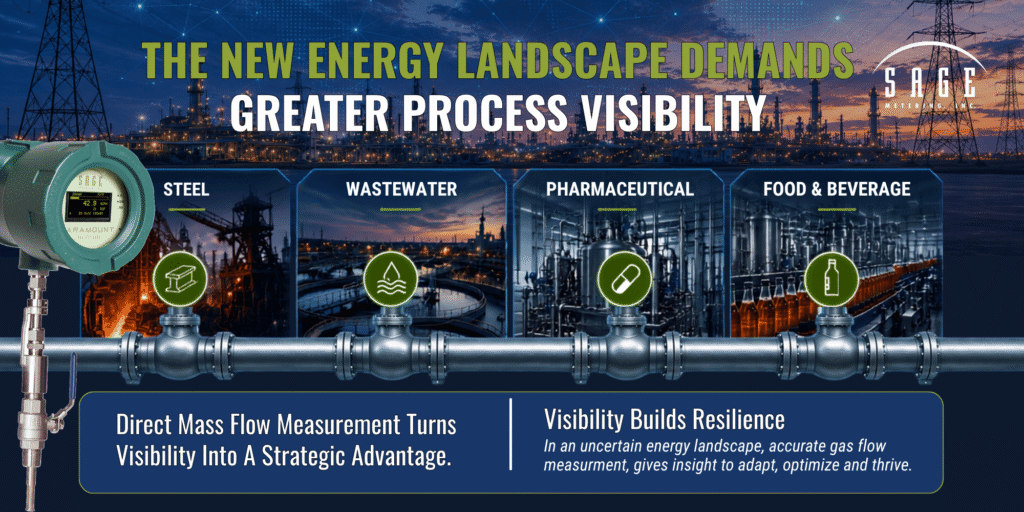
Beyond equipment availability, operators need to ask practical questions such as:
- How does consumption during standby compare with productive operation?
- Does generation align with facility demand?
- Do efficiency improvements hold up under comparable operating conditions?
Gas flow measurements help answer these questions when operators evaluate them alongside electrical output, useful heat recovery, and production data. Flow data establishes fuel use and helps operators assess what they get in return.
“When you become responsible for generating your own power, you need visibility into the entire energy chain, not just the electrical side of it.”
Sage Metering President, Fred Whorff
Why Thermal Mass Flow Measurement Fits Changing Demand
Equipment does not always operate at a steady load. Boilers and turbines may move between standby, reduced demand, at full production, and measurement needs to remain useful throughout that cycle.
Thermal mass flow meters, such as the Sage Paramount, offer several advantages for these applications.
- Direct mass flow measurement: Thermal mass flow can be measure without separate pressure and temperature compensation for conversion from volumetric flow.
- Wide turndown: Advanced mass gas flow meters cover substantial differences between minimum and maximum operating flow.
- Low-flow sensitivity: Visibility at reduced demand helps operators investigate standby consumption and other easily overlooked uses.
- Low pressure loss with insertion designs: A small sensing probe avoids the restriction associated with some differential-pressure measurement devices.
While these capabilities provide a clearer picture of fuel demand as equipment loads change, selection still depends on the gas, flow range, installation, and accuracy required for the application.
As Fred explains, a meaningful consumption record depends on selecting a /meter suited to the full range of conditions. “Operators need a meaningful consumption record across the operating cycle. Meter selection should account for minimum and maximum flow, gas composition, installation conditions, and the accuracy needed for the decision being made.”
“As facilities take greater responsibility for energy production, process visibility helps connect operating decisions with measurable results.” — Fred Whorff, President, Sage Metering, Inc.
Sub Metering Makes Energy Use Accountable
While a utility meter establishes a facility’s total gas purchases, submetering provides the next layer of detail about where consumption occurs and how it changes over time.
Measuring individual buildings, production lines, boilers, or generation equipment with mass gas flow meters connects consumption to specific activities or operating areas. This detail provides a more useful foundation for cost allocation and process improvement.
Sub-metering with thermal mass flow meters helps:
- Establish baselines for normal production, standby, and shutdown conditions
- Investigate unexpected consumption within a specific operating area
- Allocate costs based on measured usage
- Compare consumption with output to differentiate between production changes and potential inefficiency
- Check whether improvements deliver the expected reduction under comparable conditions
Fred illustrates this with a straightforward example about a customer who used Sage’s data-logging capabilities to investigate the reason for a sharp increase in gas costs. The data reveals the culprit — an overnight employee with an unusual practice of leaving a large door open during a Minnesota winter. The bill identified the expense — the consumption record helped explain it and take corrective action.
SageCom™ Turns Readings into Actionable Intelligence
Installing sub-meters establishes measurement points. Making those measurements useful requires a way to examine behavior and maintain confidence in the instruments.
Fred explains that this is where Sage Metering’s SageCom™ validation and configuration software becomes invaluable.
SageCom™ supports their users through several connected functions:
- Data logging: Record real-time measurements and export data to Excel for review alongside operating schedules or production records.
- Diagnostics and validation: Check meter performance and document diagnostic results in a validation report.
- Local configuration: Review and change supported instrument settings to suit the application.
- Gas-mixture updates: Enter supported gas constituents so the meter can correct readings for the updated mixture.
These functions connect the measurement to the investigation, if consumption changes, operators can examine the timing, compare it with plant activity, and check the instrument before deciding what action to take.
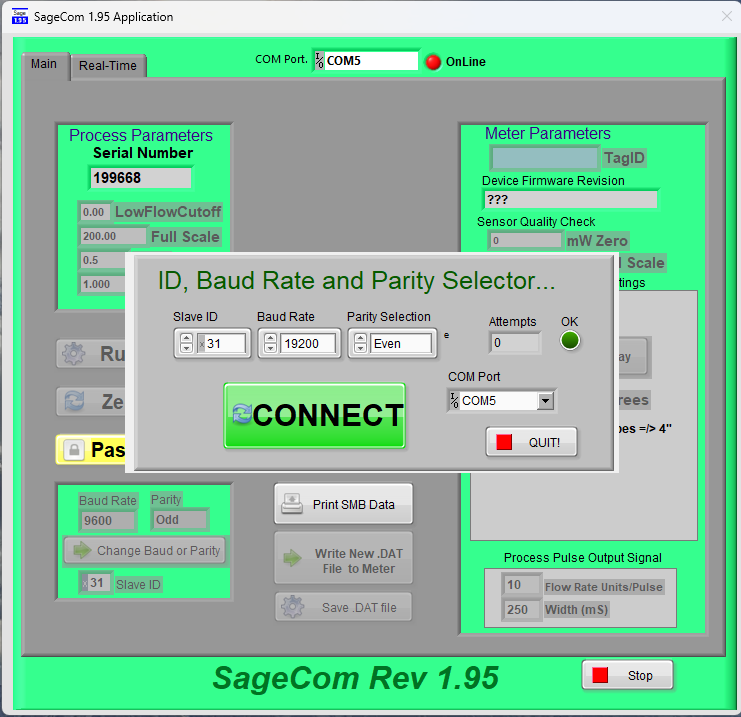

Getting started with SageCom is clear and simple. Users check or change the configuration of the instrument, such as changing full scale, pipe size, engineering units, or decimal points.
Fuel Flexibility Requires the Right Gas Configuration
Greater fuel flexibility is another consideration. Thermal mass meters respond to the thermal properties of the gas, so operators need to account for significant changes in the gas mixture to maintain measurement accuracy.
In the interview, Fred explains how Sage Metering’s SageCom™ software allows engineers to update supported gas-mix parameters in the field without having to remove the meter just to make the change.
CHANGE GAS MIX IN THE FIELD
Users can enter an entirely new set of gas mix constituents versus the original calibrated mix, and the meter will automatically correct its readings to the updated mix.
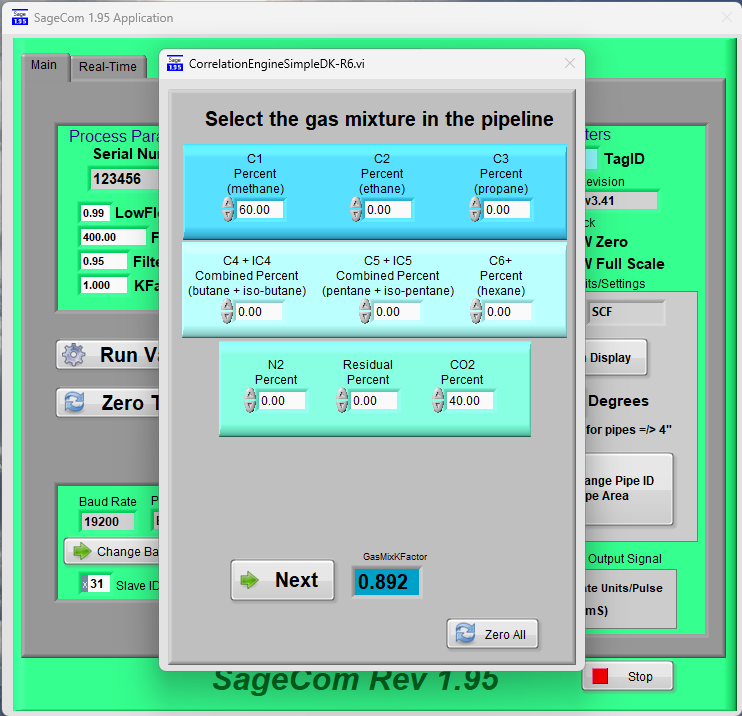
“The important point is that you’re not simply changing a display setting. The gas parameters are part of how thermal mass measurement is calculated.” Sage Metering President Fred Whorff
Compressed Air Reveals Another Opportunity
Compressed air is another example of why local visibility matters, according to Fred. “A system may continue supplying leaks or equipment after production stops, leaving energy costs buried in overall operating expenses.”
Branch-level airflow measurements help to narrow the search. By comparing demand during equivalent operating periods and during idle periods, facilities can identify areas that need a closer look. Persistent demand may indicate leaks, equipment left running, or legitimate uses that operators need to account for.
The U.S. Department of Energy’s Compressed Air Sourcebook notes that leaks can sometimes waste 20–30% of a compressor’s output. That is an industry reference range, not an estimate of any particular plant’s losses.
Thermal mass flow meters identify the scale and location of unusual consumption and narrow the search to the measured branch. After making repairs, operators can measure airflow again to verify the reduction. Actual electricity savings also depend on compressor controls and operating response.
Granular Visibility Informs Real-Time Decision-Making
At the end of the interview, Fred offers one last practical tip. “I’d start with the biggest energy user that you’re not actually measuring.”
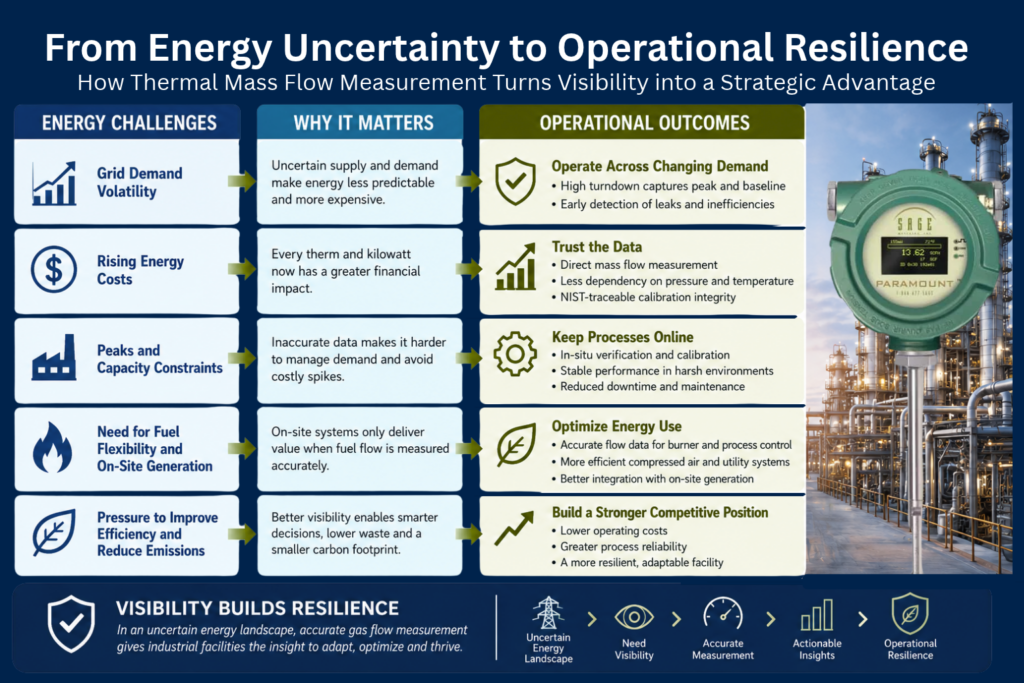
Start with a major energy user whose consumption can’t be explained, like a boiler with unusually high fuel demand, a compressed-air branch with persistent idle consumption, or generation equipment whose fuel use is difficult to compare with output.”
- Establish a Baseline
- Compare with Operating Activity
- Investigate Patterns
- Act on the Findings
- Measure Results of Corrective Action
On-site generation gives facilities additional options for managing energy exposure. Submetering provides the local visibility into consumption, while SageCom™ helps teams work with the data and the instrument. Together, these tools help operators evaluate their options, investigate potential waste, and track performance as conditions change.
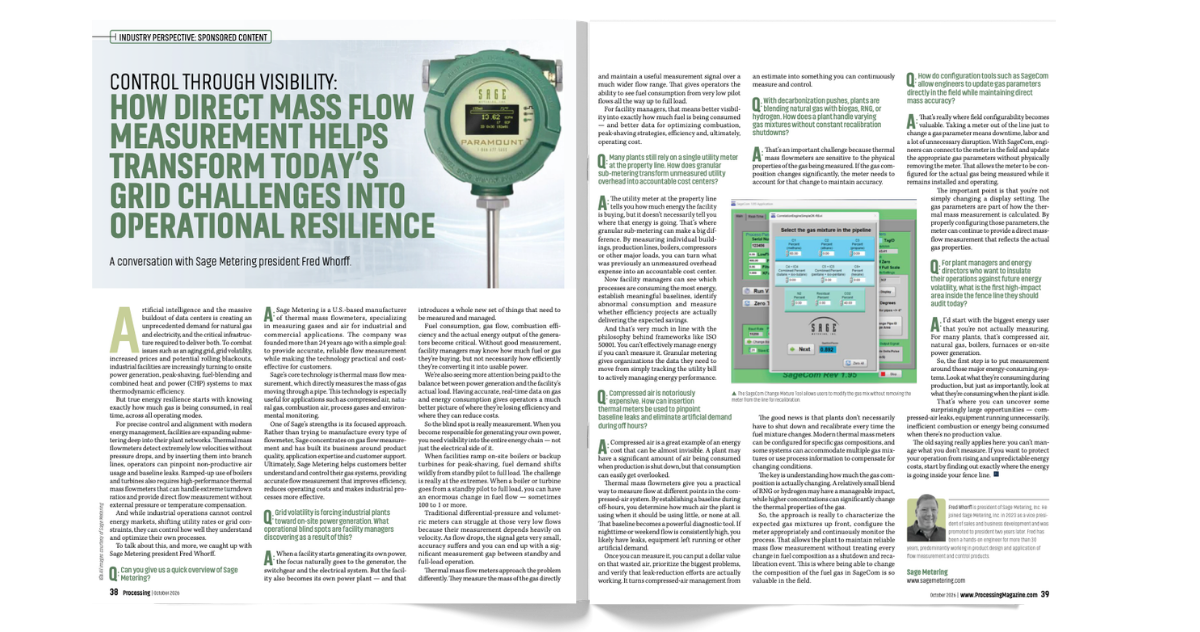
For more on fuel measurement, sub-metering, compressed air, and field configuration watch Fred Whorff’s full Processing Magazine interview . You can also read the companion article in Processing’s October 2026 issue.
To see which Sage Thermal Mass Flow Meter will best suit your onsite energy production needs, contact one of our sales team members or our manufacturer’s representatives closest to you.
